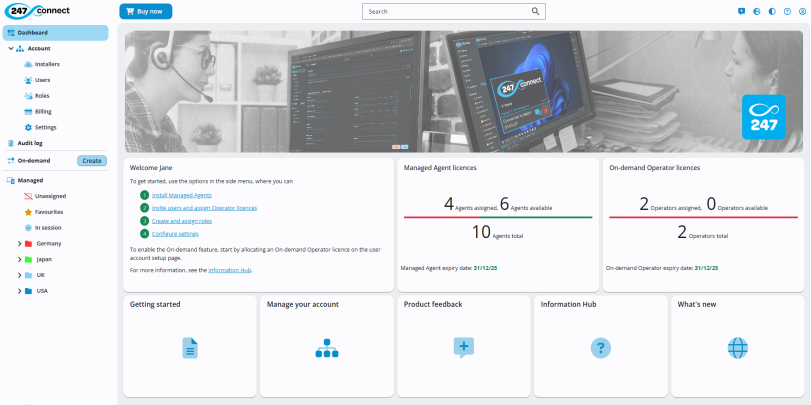
Web Portal user interface
The 247connect Web Portal is where you'll find everything you need for setting up and using 247connect.
-
The features available to you depend on your assigned role and permissions.
-
Your Web Portal session times out after 15 minutes of inactivity. A message appears after 13 minutes and you have 2 minutes to respond before being logged out automatically.
Customise the interface
By default, 247connect matches to your system theme. To change it:
-
Click the Theme
 icon in the top menu.
 -
Select System, Dark or Light mode.
To change the interface language
-
Click the Globe
 icon in the top menu.
 -
Select your preferred language.
Languages supported: English (UK and US), German, Spanish, French, Italian and Korean.
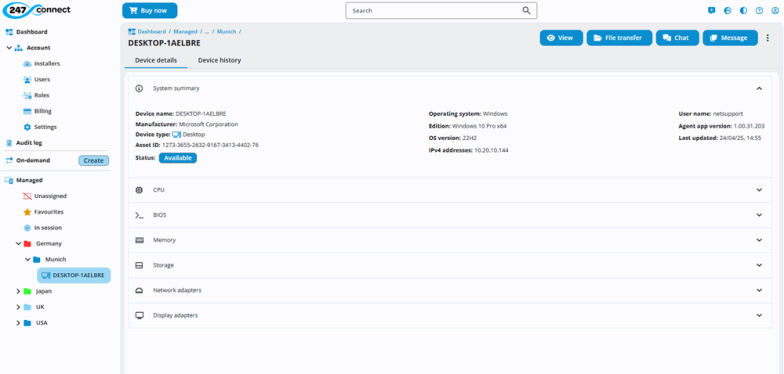
Web Portal layout
The 247connect Web Portal includes the following sections:
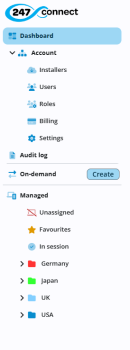
Side menu
Provides access to the main 247connect features. The options available depend on your role. You can resize the menu if needed.
Breadcrumbs
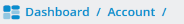
Shows your current location within the interface.
Search
Use the search field at the top of the page to find devices, device groups, roles, users and user groups. Start typing to display matching results.
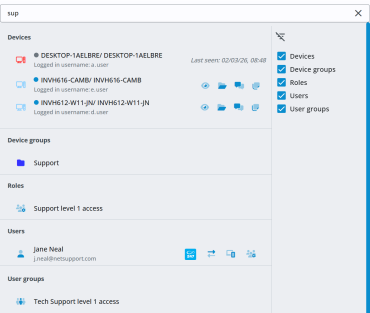
Results are grouped by category. Use the checkboxes on the right to filter what is shown. All categories are selected by default. Click the Filter ![]() icon to show or hide the filter options.
icon to show or hide the filter options.
Device entries include a status icon that indicates the current state:
-
Blue indicates the device is available
-
Grey indicates the device is unavailable
Icons to action remote tasks are displayed only when the device is online.
Selecting a result takes you to that page. Click Close ![]() to end the search.
to end the search.
Top menu
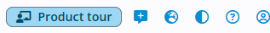
From here, you can:
-
Access the product tour (only available for Global Administrators).
-
Send feedback to us.
-
Switch the user interface language.
-
Switch the theme.
-
Access the Information Hub and our contact details.
-
Access your profile.
Display area
Shows the content related to the selected side menu option.
Toolbar

The toolbar appears when you select a managed or on-demand device. It gives you access to remote control features and support tools. You can also end an on-demand session or click the three dots icon![]() to manage the device.
to manage the device.
-
You must have the Control component installed to use these features.
-
The features available in the toolbar depend on the platform the Agent is running (Windows, Android or macOS).


